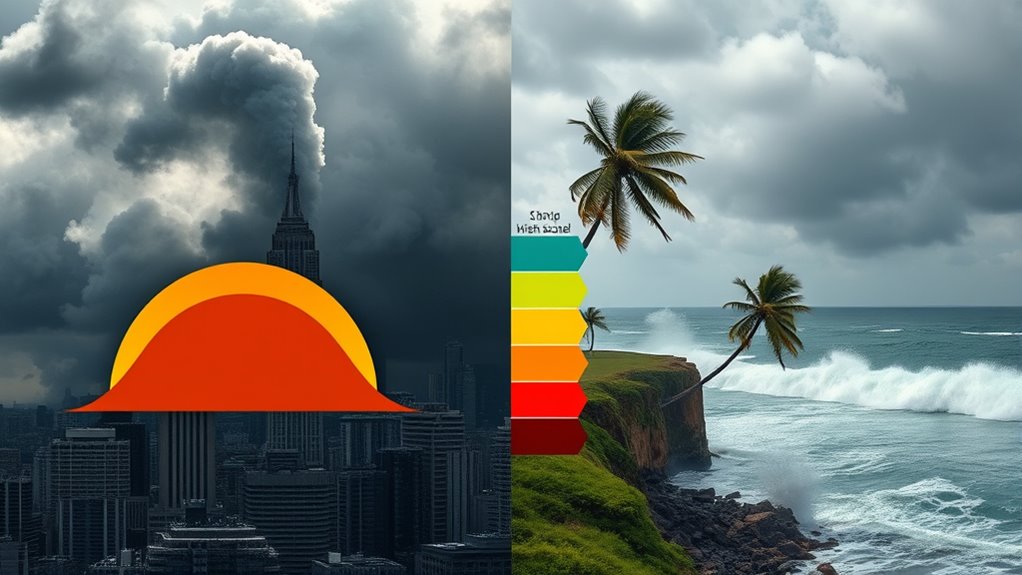

Disaster risk scales like the Richter and Saffir–Simpson help you understand the strength and potential impact of natural events. The Richter scale measures earthquake magnitude, with each whole number representing about 32 times more energy. The Saffir–Simpson scale categorizes hurricanes from 1 to 5 based on wind speed and damage potential. Learning how these scales work can improve your awareness of risks and response strategies; exploring further will reveal how they guide safety decisions.
Key Takeaways
- Disaster risk scales categorize event severity using measurable data like magnitude or wind speed.
- The Richter scale quantifies earthquake strength, with each point representing roughly 32 times more energy.
- The Saffir–Simpson scale classifies hurricanes from Category 1 to 5 based on wind speed and potential damage.
- These scales help interpret scientific hazard data into understandable risk levels for planning and response.
- Accurate hazard measurement ensures reliable risk assessment, guiding safety measures and resource allocation.
Have you ever wondered how experts measure the potential impact of natural disasters? It all comes down to hazard measurement and risk assessment. These processes help scientists and emergency planners understand how severe a disaster could be and how much damage it might cause. Hazard measurement involves quantifying the strength or intensity of a natural event, such as an earthquake or hurricane, which provides a standardized way to compare different events. Risk assessment then combines this hazard data with factors like population density, infrastructure vulnerability, and historical patterns to estimate the overall threat to a community or region. Together, these steps form the backbone of disaster risk scales, which serve as essential tools for decision-making and preparedness.
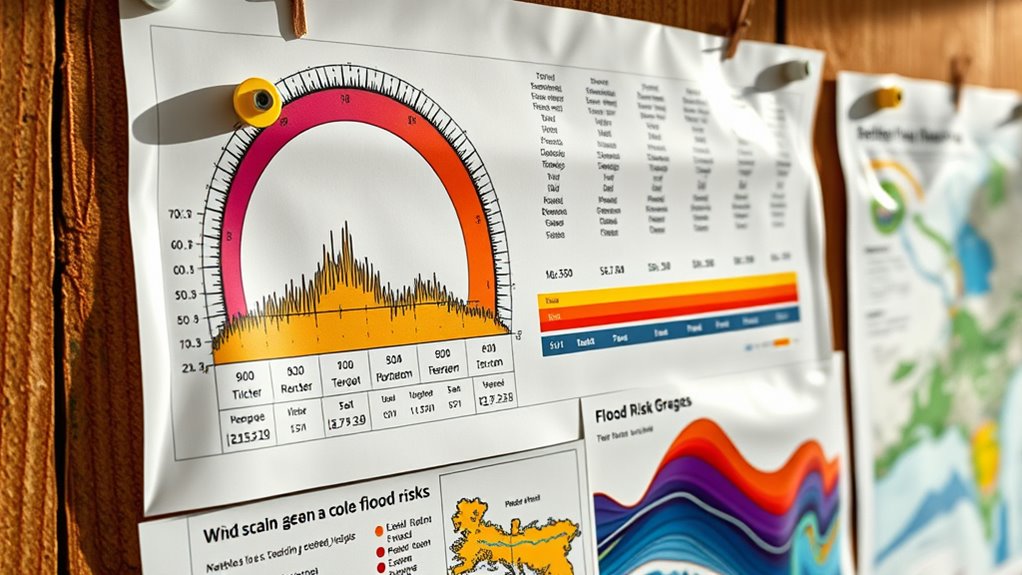
Disaster risk scales are crafted to translate complex scientific data into understandable categories, often using a numerical or descriptive system. For earthquakes, the Richter scale is a well-known example. It measures the magnitude of seismic activity, with each whole number increase indicating roughly 32 times more energy released. This scale helps you grasp the severity of an earthquake quickly, guiding officials on the necessary response and safety measures. For hurricanes, the Saffir–Simpson scale classifies storms from Category 1 to Category 5, based on wind speeds, storm surge, and potential damage. This scale allows you to assess the likely impact of a hurricane before it makes landfall, influencing evacuation plans and resource allocation.
These scales are not just about labeling disasters; they’re about understanding potential consequences. The hazard measurement component provides a numerical value that reflects the event’s strength, but risk assessment contextualizes this data within the environment. For instance, a high-magnitude earthquake in an unpopulated area might pose less risk than a moderate quake hitting a densely populated city. Similarly, a Category 3 hurricane might be manageable in some coastal regions but catastrophic in others, depending on local preparedness and infrastructure resilience. Recognizing the importance of accurate hazard measurement helps improve the reliability of these risk assessments.
seismic earthquake magnitude meter
As an affiliate, we earn on qualifying purchases.
As an affiliate, we earn on qualifying purchases.
Frequently Asked Questions
How Are Disaster Risk Scales Developed and Standardized Globally?
You develop disaster risk scales through scale calibration, which involves analyzing historical data and scientific measurements to guarantee accuracy. International standards guide this process, ensuring consistency across regions. Experts collaborate to refine the criteria and thresholds, making the scales reliable and comparable globally. This standardized approach allows for better risk assessment, preparedness, and response strategies, ultimately helping communities understand and mitigate disaster impacts effectively.
Can Disaster Risk Scales Predict the Exact Time and Location of Events?
Just like predicting who shot J.R., disaster risk scales can’t forecast the exact time and location of events. With advancements in forecast accuracy and real-time detection, we can anticipate when and where hazards might strike, but pinpointing the precise moment and place remains beyond reach. These scales help assess severity, but they don’t serve as crystal balls, so always stay prepared and alert for unpredictable shifts.
How Do Different Scales Compare in Assessing the Same Disaster?
When comparing different scales for the same disaster, you find that scale accuracy varies because each scale measures different aspects, like strength or potential damage. You may face comparison challenges since some scales focus on intensity, while others emphasize impact. This makes it tricky to directly compare results, but understanding each scale’s purpose helps you interpret the assessment more accurately and make better-informed risk decisions.
Are There New or Emerging Disaster Risk Scales Not Widely Adopted Yet?
Emerging scales are being developed, leveraging technological innovations like remote sensing, GIS, and real-time data analysis. These new approaches aim to provide more precise risk assessments for disasters such as floods, wildfires, and earthquakes. While they’re not yet widely adopted, they hold promise for improving response and preparedness. You should keep an eye on these developments, as they could soon complement or even surpass traditional scales in accuracy and applicability.
How Do Personal or Community Factors Influence Risk Level Assessments?
Think of your community as a sturdy ship and yourself as its navigator. When community resilience is high and individual preparedness is strong, your risk level drops like a stone in calm waters. Conversely, weak community ties or unprepared individuals can send your risk soaring like a stormy sea. Your actions and collective strength shape the tide, making the difference between sinking and sailing smoothly through disaster.

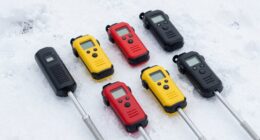
BTMETER BT-100 Handheld Anemometer, Digital Wind Speed CFM Meter Gauge Air Flow Velocity Tester for HVAC Shooting Drone, Wind Chill, 14℉-113℉ Wind Temperature
【Multifunction Pro Anemometer】Wind Speed, Wind Temperature, Wind Chill, Low battery indicator on bright backlit LCD screen. BT-100 is…
As an affiliate, we earn on qualifying purchases.
As an affiliate, we earn on qualifying purchases.
Conclusion
As you stand before these scales, think of them as your compass through chaos—each symbol representing a different storm’s story. Just like a lighthouse guides ships home, understanding these scales lights your way through uncertainty. Remember, whether it’s Richter’s ripple or Saffir–Simpson’s roar, they’re tools to help you navigate nature’s unpredictable dance. Embrace their symbolism, and let them be your steady heartbeat amid the storm’s symphony.

Understanding Disaster Insurance: New Tools for a More Resilient Future
As an affiliate, we earn on qualifying purchases.
As an affiliate, we earn on qualifying purchases.

Complete Earthquake Bag – Emergency Kit for Earthquakes, Hurricanes, Wildfires and Other Disasters – Built for 2 Person for a 3 Day Period
COLOR-CODED ORGANIZATION SYSTEM: Built for 2 Person for a 3-Day Period, Organized in Re-sealable Waterproof Packs
As an affiliate, we earn on qualifying purchases.
As an affiliate, we earn on qualifying purchases.